
I Spent 48 Hours Reverse-Engineering a $2,000/Year Institutional Signal. Here's Why I'm Not Using It.
The [Trend Model]. [Redacted]'s crown jewel. I cracked it open, rebuilt it from scratch, and then did something most quants won't admit to.

Earlier this week I went down a rabbit hole, the kind where every answer spawns three new questions, and you can't stop because you keep feeling like you're this close.
A quick note before we go any further: I’m not naming the institutional research firm behind the data. A lot of what I used sits behind a paywall, and I want to respect their proprietary work. Where needed, I’ve replaced identifiers: the firm is [Redacted], their model is [Trend Model], and any other sensitive details are in brackets. This was done after my initial rough draft.
Now.. forget all of that for a second and just look at this chart.
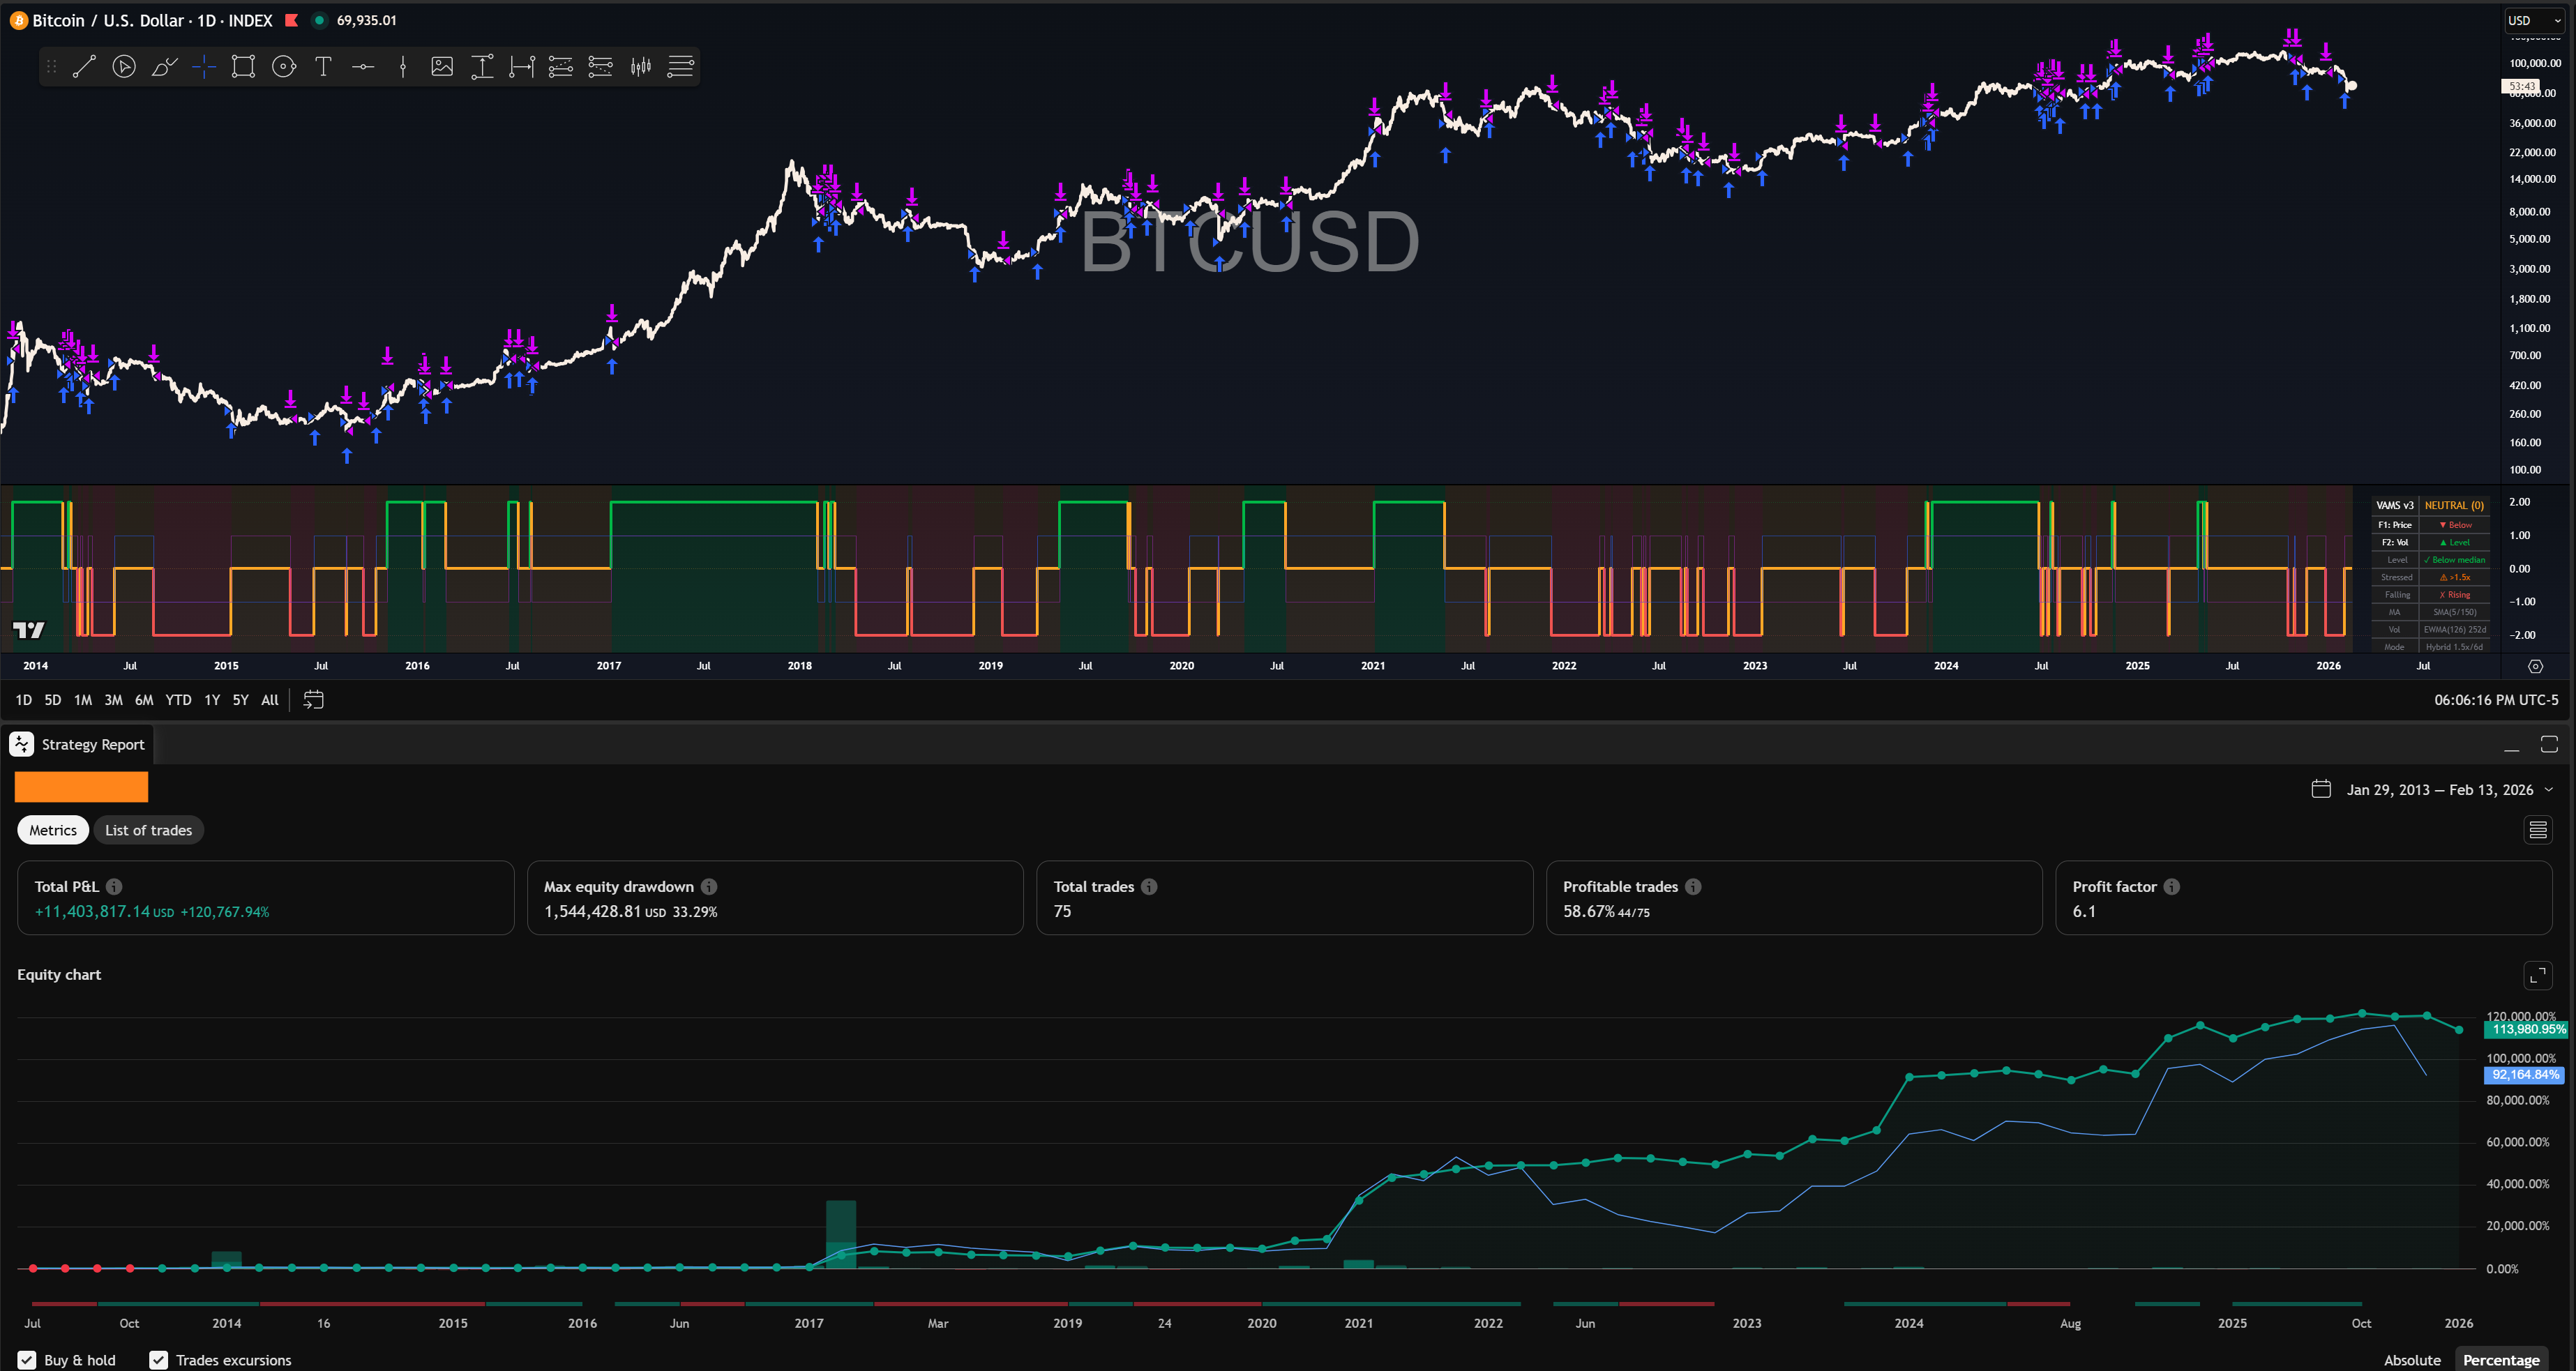
That’s a 6.1 Profit Factor on Bitcoin with a max drawdown of ~33% all while matching buy & hold. From a single indicator overlay.
[Redacted] charges roughly $2,000/year for access to their [Trend Model]. It’s a proprietary signal used by institutional macro traders across equities, bonds, crypto, and commodities. They don’t tell you how it works. They just hand you the signal and a backtested allocation strategy: full long, [some smaller allocation], or flat.
I wanted to know what was under the hood. So I took their published CSV of 6,400+ days of actual signals, their PDFs, their reports, and I reverse-engineered the entire thing from first principles.
48 hours. Three full sessions. Dozens of parameter sweeps. Five volatility models tested. One architecture fully decoded.
Here’s what I found.. and more importantly: why the most valuable lesson had nothing to do with the indicator itself.
"I have not failed. I've just found 10,000 ways that won't work."
— Thomas Edison
Cracking the Architecture
The first breakthrough was realizing [Trend Model] isn’t what most people think. The community assumes it’s a continuous Sharpe ratio or some kind of momentum oscillator. It’s not.
It’s a two-factor binary scoring system.
Factor 1 (price momentum) outputs +1 or -1.
Factor 2 (volatility regime) outputs +1 or -1.
Sum them: you get -2, 0, or +2.
That’s it. That’s the whole signal.
Factor 1 turned out to be dead simple.. SMA(5) vs SMA(150) for equities. We matched their price factor on 97.5% of all trading days. Not estimated. Mathematically proven by decomposing the signal algebraically.
Factor 2 is where it gets interesting. The public description says “compare short-term vol to its [redacted] median.” That’s accurate but incomplete.
It only explains about 76% of their signals. The other 4% that closes the gap to 80%? A hidden (or unmentioned) stress-gated override that fires during crisis recoveries.. when volatility is elevated but falling.
This is how they caught the COVID recovery in April 2020 when realized vol was still 3x above median.
No simple “vol < median” comparison could produce a bullish reading at that point. The override is the proprietary edge.
We also discovered that EWMA (exponentially-weighted) volatility at span=[150-200] outperforms rolling standard deviation by 3+ percentage points. And we proved through exhaustive testing of GARCH, VIX term structure, synthetic contango, asymmetric hysteresis thresholds… that 80% is the practical ceiling using close-to-close data on TradingView.
Here is a screenshot of the finished (80% match product on SPY 0.00%↑ ):
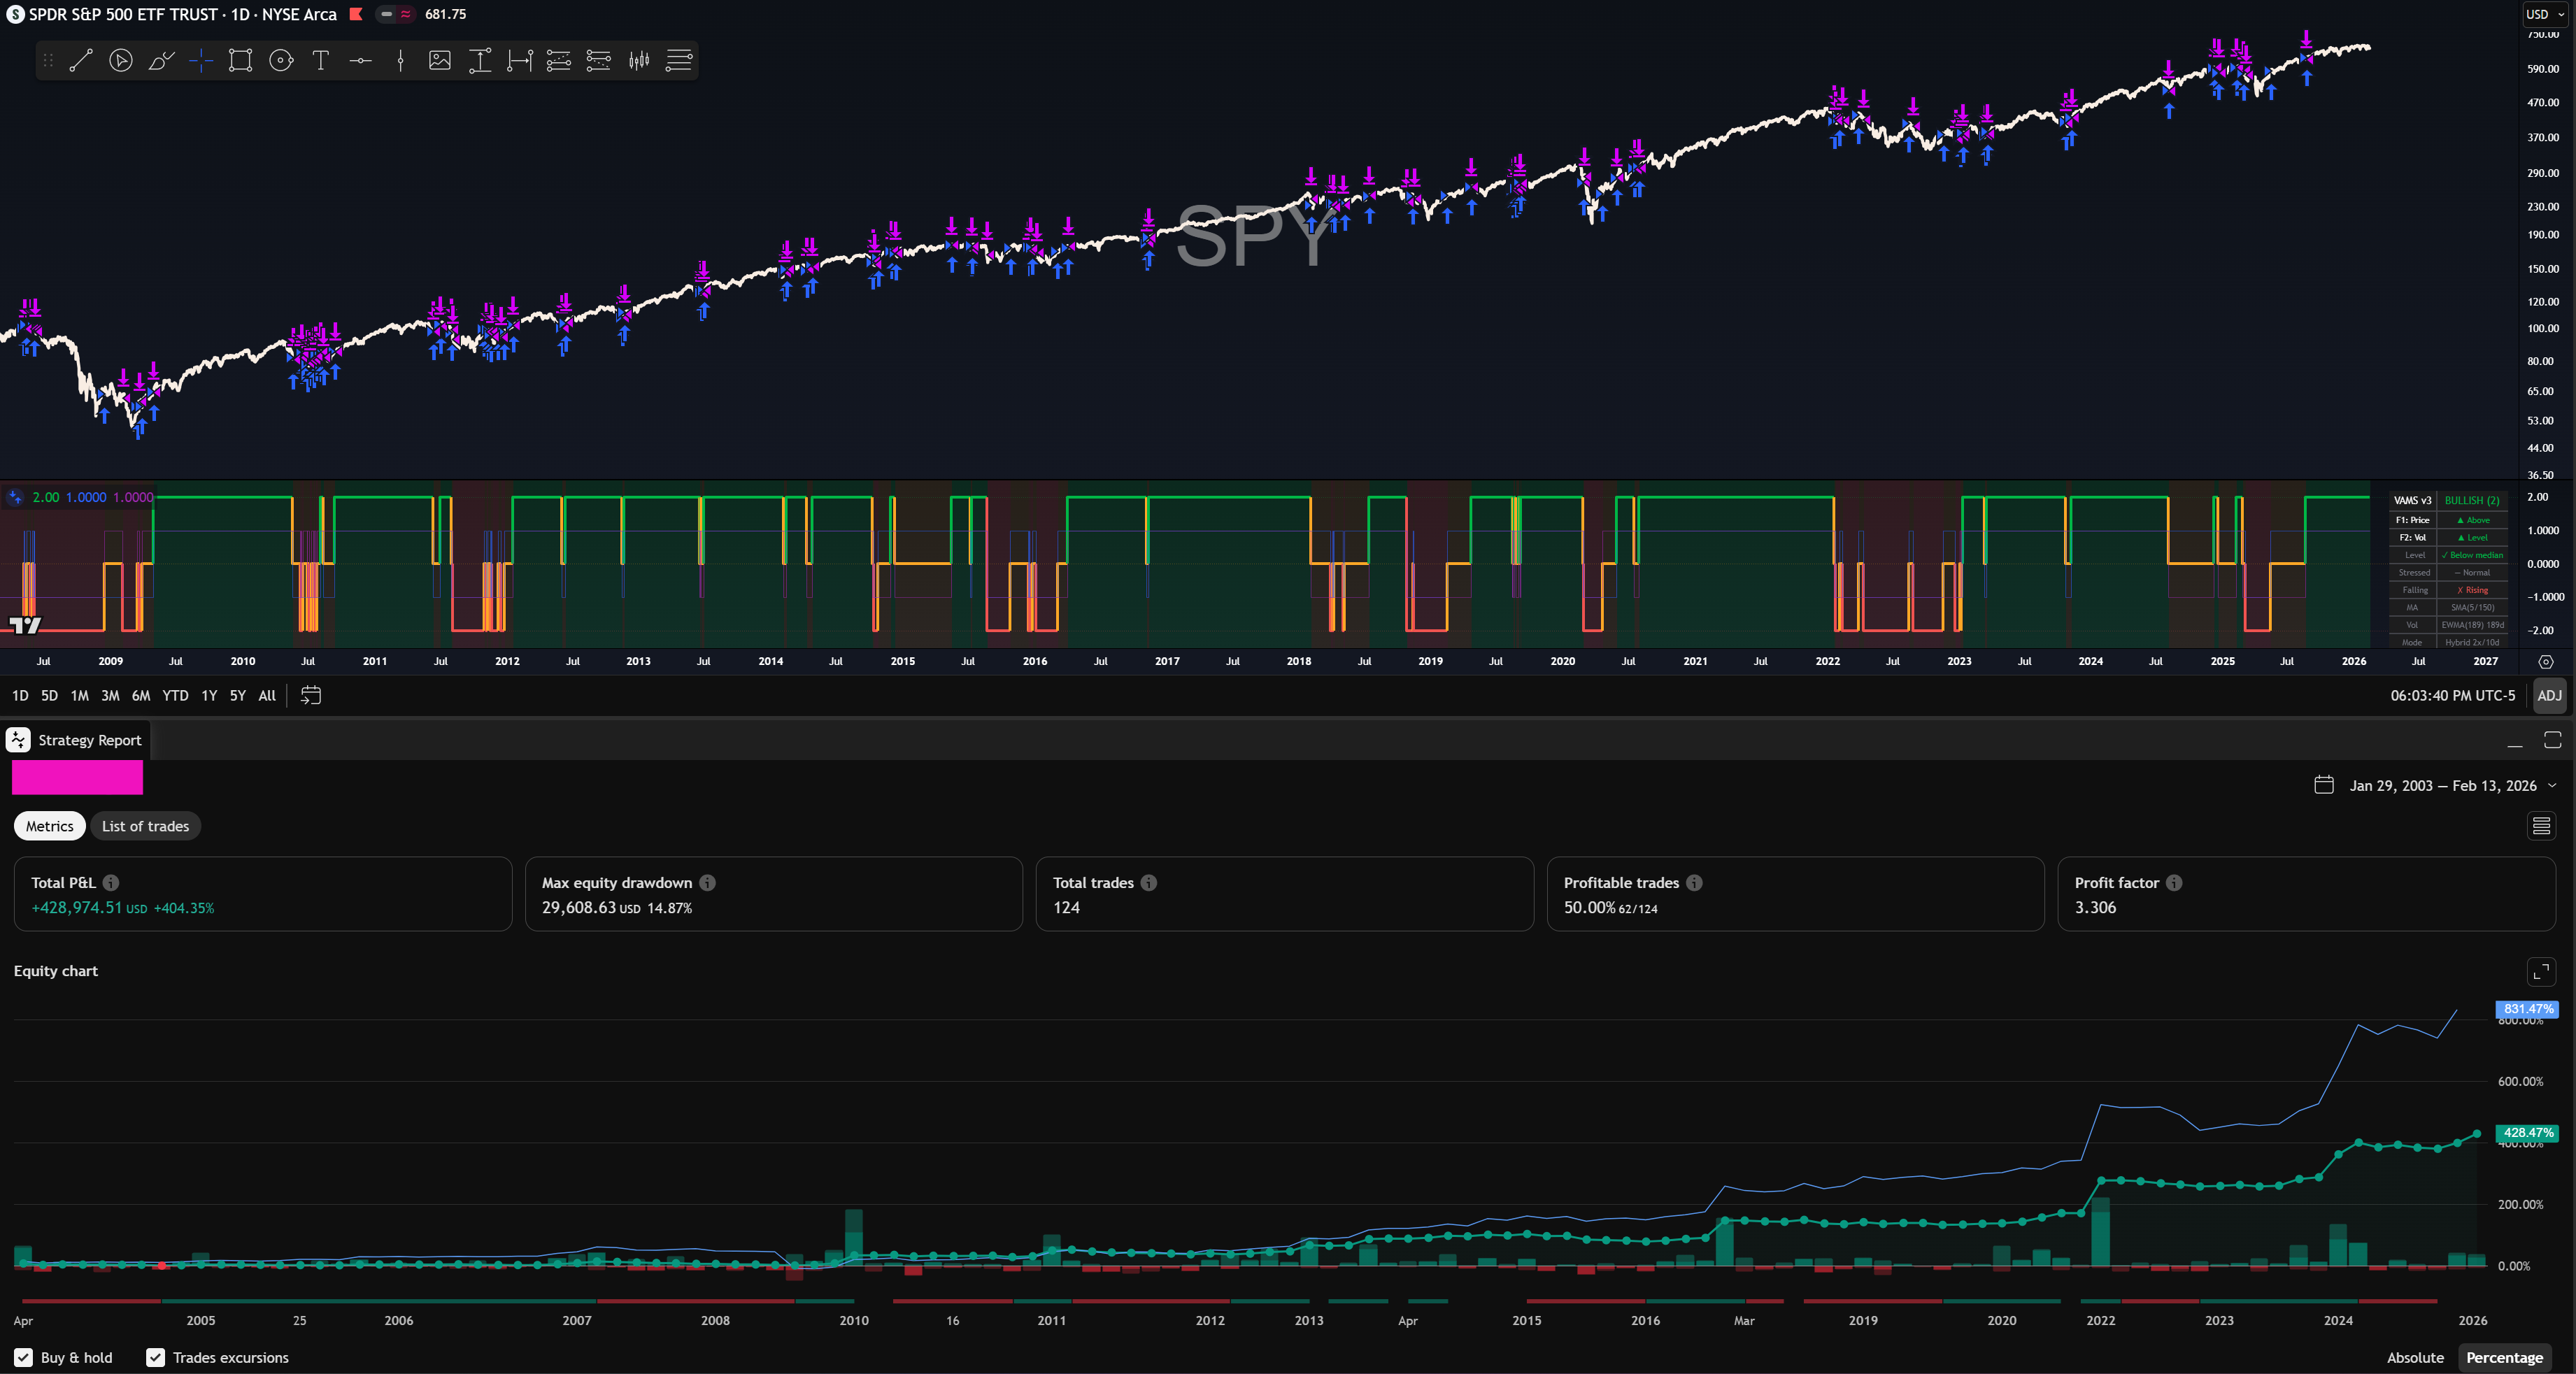
The remaining gap to their signal is a Bloomberg data infrastructure problem, not a logic problem. Access to a Bloomberg terminal costs $25,000~ roughly a year? Too rich for my blood.
So what do we have at this point? We have an indicator that matches 80% of their signal and some decent backtesting results (more on that later).
Then I Did Something Dangerous: I Compared It To My Own Systems
This is the part nobody writes about. You spend days building something, you’re proud of it, and then you have to be honest about whether it actually earns a spot in potentially running your portfolio.
So I ran the [Trend Model] replica on SPY and BTC, then put it side-by-side with the Macro Regime Engine and The 8th Rule.
The numbers weren’t even close.
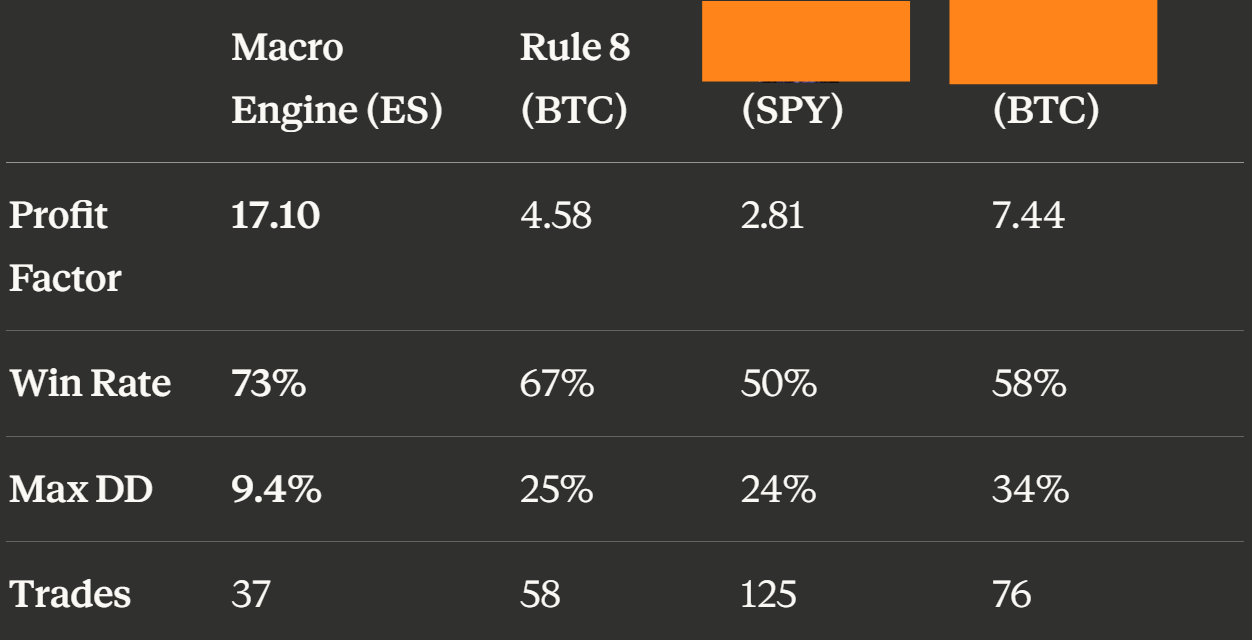
The Macro Regime Engine has a 17:1 profit factor over 25 years. Seventeen to one. It trades 1.4 times per year with a 73% win rate and a max drawdown under 10%. The [Trend Model] on the same asset class? 2.8 PF, coin-flip win rate, and ~2.5x the drawdown.
The 8th Rule on Bitcoin? Dynamic position sizing, 25% initial allocation when the fast indicator triggers, full 100% only when the slower signal confirms, aggressive exit if either goes bearish. The scout position was 0-for-5 when [Trend Model] never confirmed, averaging -13% per trade (this confirmation is something I’ll be looking at deeper in the future). But at 25% size, the portfolio impact was only -3.3% each time.
Meanwhile, when both signals agreed and it went straight to 100%, those trades averaged +44.7%. The asymmetry is the edge. The sizing IS the risk management.
[Trend Model] does 0%/[smaller allocation]%/100%. It works. But it’s a blunter instrument than what I already have.
The Real Lesson
Here’s what 48 hours of reverse-engineering actually taught me:
The architecture matters more than the signal. [Redacted]’s [Trend Model] is a solid two-factor binary system. But a solid two-factor binary system inside a 23-asset voting engine that detects macro regime changes? That’s a different animal entirely.
And a solid two-factor binary system paired with a fast-trigger scout mechanism and dynamic position sizing? That’s another level of sophistication that a standalone [Trend Model] can’t replicate.

I didn’t waste those 48 hours. I now understand exactly how volatility-adjusted momentum works at the component level, the EWMA advantage, the stress-gated override, positive vs inverse vol correlation (ie: high vol on Bitcoin = bullish, high vol on SPY = bearish) by asset class.
“Fall seven times, stand up eight.”
— Japanese proverb
Those discoveries could improve the individual [Trend Model] scores feeding into the Macro Regime Engine’s 20+ asset votes. Better components inside an already-proven architecture. That’s where the real alpha is.
But replace my existing systems with a $2,000/year signal I can now build for free? No. The math says no.
The Takeaway
If you don’t have a system, the [Trend Model] replica I built is genuinely good. 80% match to an institutional signal, 13% max drawdown on SPY with dynamic position sizing, and if there’s interest will be released on TradingView free for subscribers. For someone going from discretionary trading to systematic, it’s a massive upgrade.
But if you’ve already built something that works, something with years of validation, proper position sizing, and risk management baked into the architecture.. don’t get seduced by the shiny new thing just because you can build it.
The hardest part of systematic trading isn’t building new systems. It’s having the discipline to say “what I have is better” and not touch it.
Build. Compare. Be honest. Execute what works.
That’s the whole game.
The [Trend Model] 2F v3 indicator and full research summary will potentially be available to Substack subscribers. If you want to dig into the architecture yourself or use it as a starting point for your own system, it’s all there.. parameters, code, and the complete reverse-engineering documentation. Shoot me a DM if interested, if there’s enough, I’ll release them free along with the comprehensive summary.
fascinating read